The Insight Explorer view allows you to explore data and extract insights by asking questions in natural language and receiving structured, explainable visual answers directly inside an Omniscope report that you can verify, validate and reuse as artefacts.
For 20 years, we have built Omniscope around one core idea: Trust. When you make decisions with data, you are relying on the software to help you see things clearly. That is why we treat AI as a high-speed interface for our deterministic engine.
The Insight Explorer is not a "black box" that presents truth by default. Instead, it acts as the verification layer built on top of your data, where every generated output is grounded in logic that you can inspect and own.
TABLE OF CONTENTS
- What is the Insight Explorer View?
- Quick start: setting up the Insight Explorer view
- Guided example: Climate & Energy
- Using the View - Asking our first question
- Inspecting the query behind a result
- Inspecting the generated charts behind an answer
- Inspecting calculations behind an answer
- From Answers to Reusable Artefacts
- View configuration (for Editors)
- Conclusion
In this article, we'll walk through a practical example using public climate and energy data. We'll explain how the view works, and show how it can be configured for different audiences - from analysts to report consumers.
What is the Insight Explorer View?
The Insight Explorer view is a special type of view in Omniscope. Instead of configuring the chart up front, you ask a question in plain English and receive a structured answer that can include:
- Headline summaries, in plain language, for quick conclusions
- Badges explaining model assumptions and limitations.
- Visualisations (KPIs, bars, lines, pies, maps, tables)
- Audit trails, clear explanations, step-by-step reasoning, query lineage and caveats.
Key advantage: the view is not tied to a single dataset. It can reason across all data sources connected to your report simultaneously.
Importantly, the view:
- Can query and transform all data sources and explain how it arrived at an answer.
- Allows you to inspect the queries, transformations, visualisations to verify the generated output.
- Acts as a "Report Builder" component, providing controls to reuse the generated artifacts (queries, views) in your workflow.
Quick start: setting up the Insight Explorer view
To use the Insight Explorer view you need to enable and configure AI in Omniscope. Full instructions can be found here.
Open the Add Block menu and add a Insight Explorer report to the workflow. It's a template with a Insight Explorer view pre-added.
Now connect all source blocks you want to interrogate to the report block - and execute.
Click on the report block to open it. You should see the view inside the report.
Alternatively you can add a Insight Explorer view to any existing report by clicking the Add view button.
The view consists of two main areas:
- A chat panel on the right, where you ask questions
- A results panel on the left, where answers are displayed.

Guided example: Climate & Energy
In this example, we use three public datasets related to climate, energy and transport. They are related but not perfectly aligned - which makes them a good real-world test case.
CO2 emissions data.
The CO2 dataset comes from Our World In Data, a research organisation based at Oxford University. This dataset includes emissions by country and year and per-capita metrics.
Source:
https://ourworldindata.org/co2-and-greenhouse-gas-emissions?utm_source=chatgpt.com
Global energy data
The global energy data also comes from Our World in Data. It includes electricity generation by source (coal, gas, oil, renewables, etc.), along with energy consumption and share metrics.
Source:
https://ourworldindata.org/energy
Electric vehicle adoption data
We also include EV sales data from the International Energy Agency (IEA). This dataset shows electric vehicle sales by country and year.
It allows us to explore questions such as:
Are high-emission countries also transitioning to EVs
Create a new Omniscope project and drop each of these CSV files onto the workflow.
Using the View - Asking our first question
Lets start with our first question:
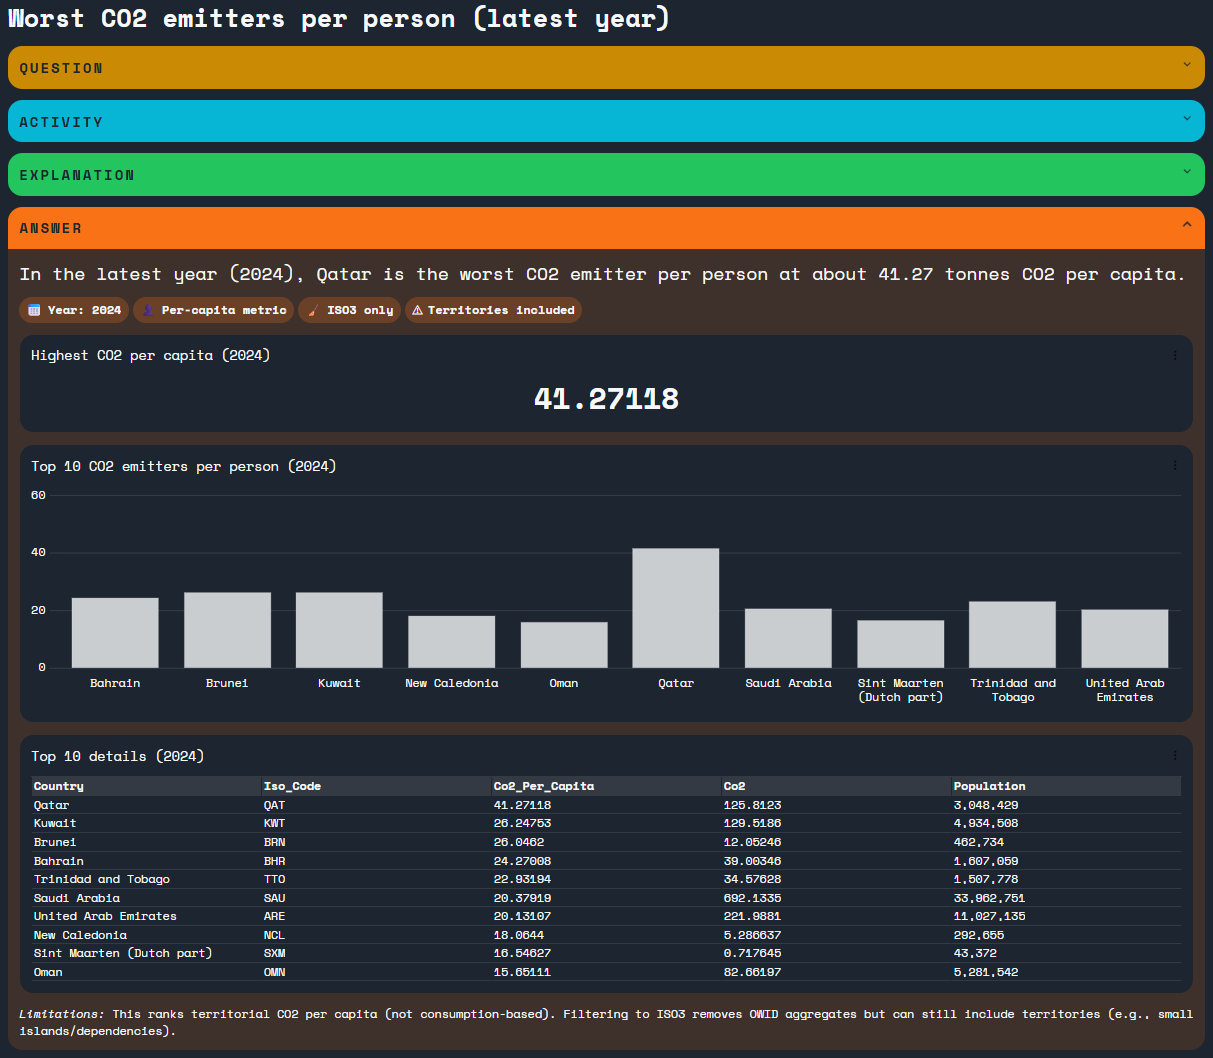
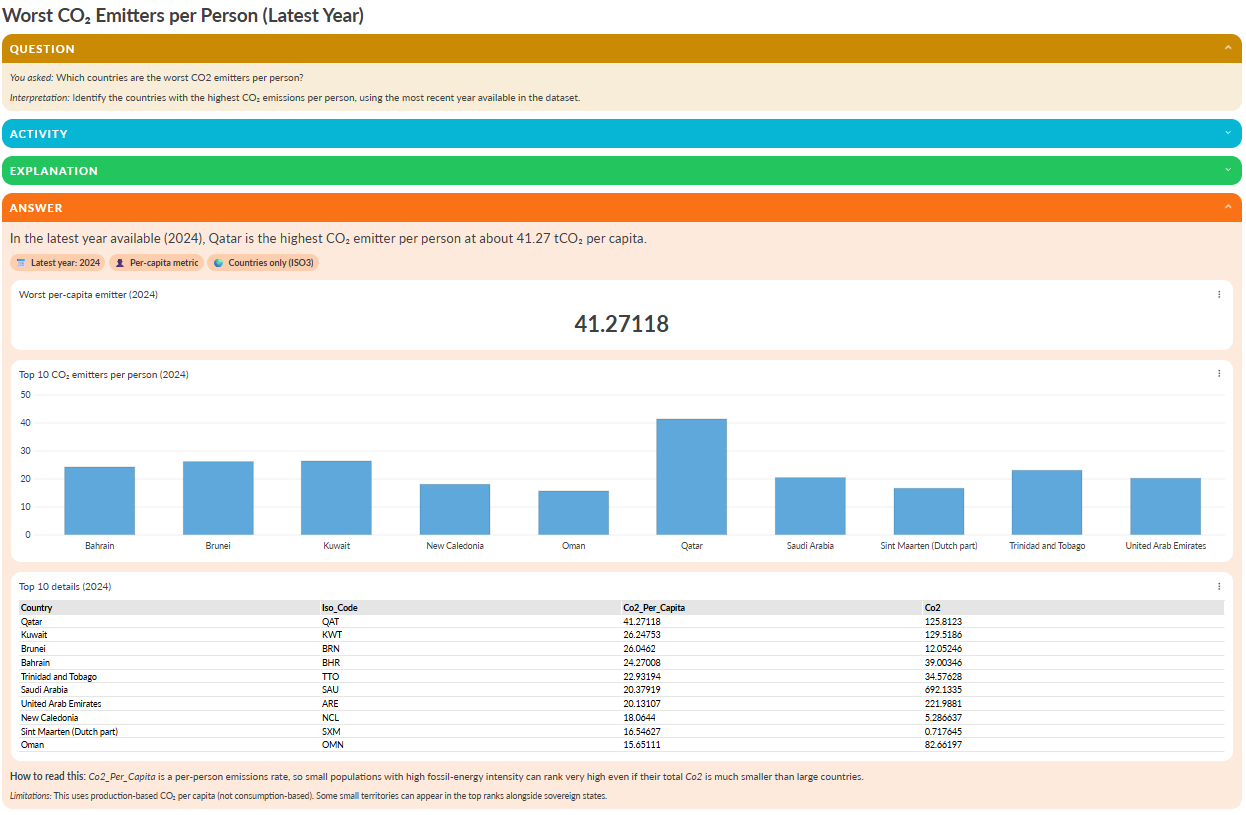
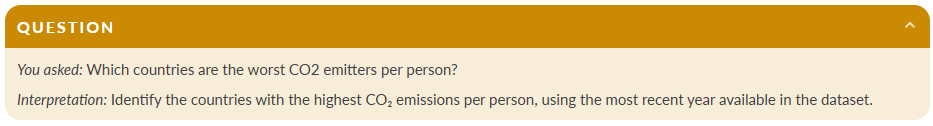
Which countries are the worst CO2 emitters per person
Enter the question in the chat panel and hit return. You'll see a brief period of thinking, followed by the answer streaming into the results panel.
Once the answer has finished streaming we can examine it in more detail.
The Question and Answer sections are expanded by default.
At the top of the answer we see a clear headline summarising the result.

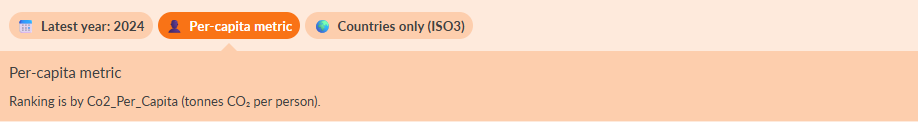
Below the headline are a number of badges. Each badge represents an assumption or limitation used by the AI. Clicking a badge reveals more detail.
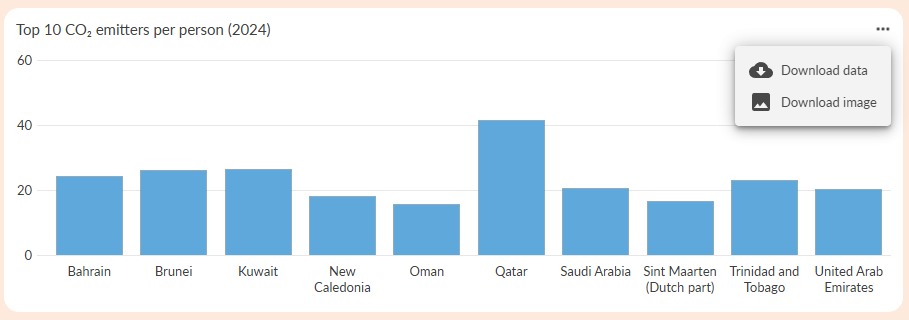
The main body of the answer is a mix of text and charts. Using the tools menu on any chart, we can download the underlying data or export the chart as an image.
Above the answer the Question section shows the user question and the AI's interpretation of that question.
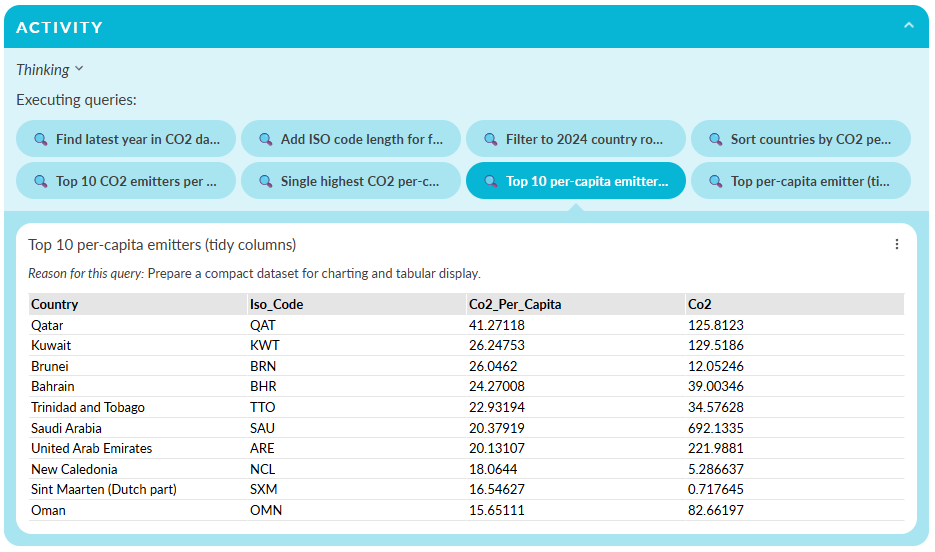
The Activity section shows the thinking and the queries the AI executed. Each query can be opened to display the results in a table, and - like other charts inside the view - data or an image can be downloaded.
The Explanation section shows how the AI reached its conclusion. Each pill represents a step in the reasoning process, and clicking a step reveals the queries used.
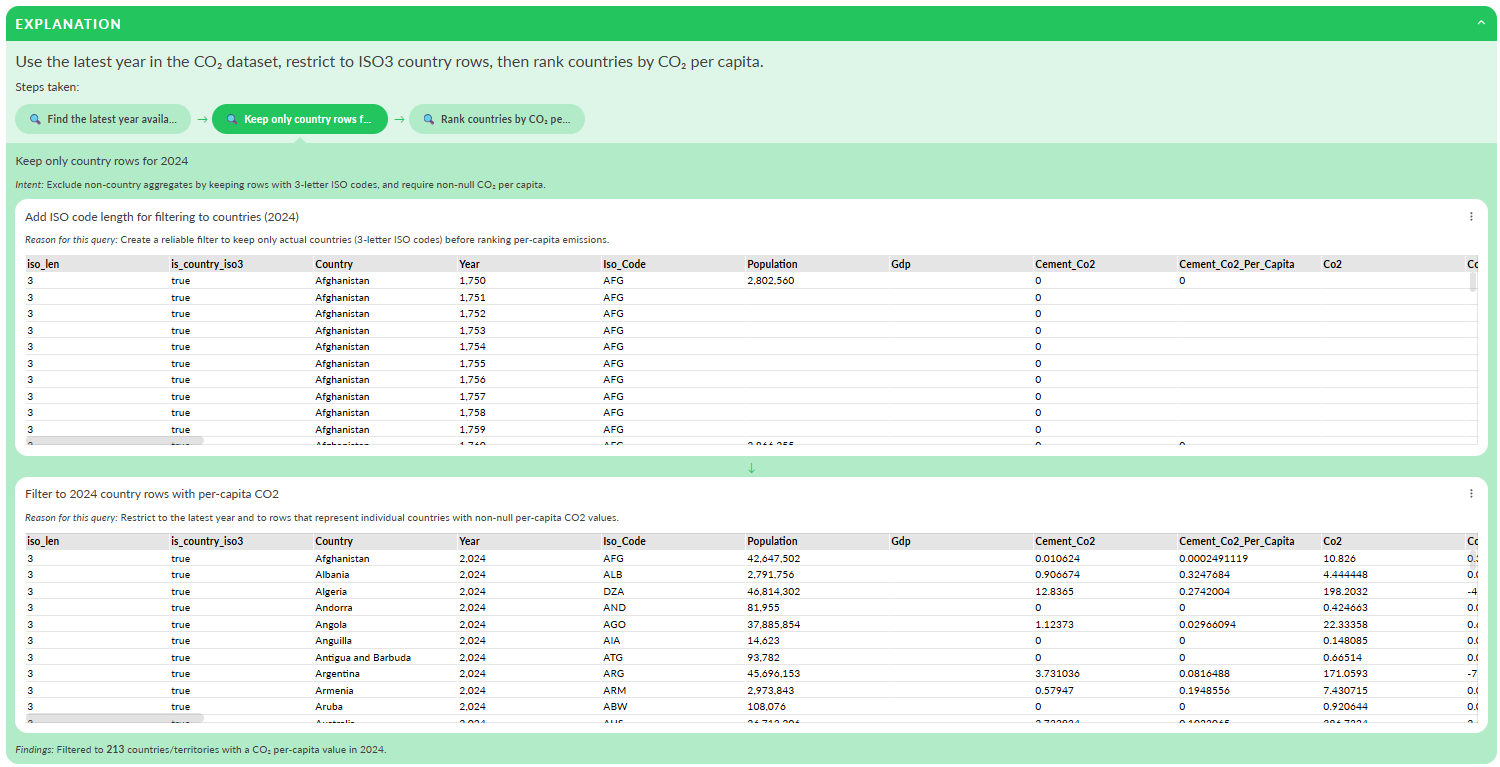
The Activity/Explanation sections are important because they show:
- What the AI actually did
- That the answer is based only on the report's data and no external data sources were used
As an editor you can decide which sections are visible. If you want to show just the answer you can:
- Open the view settings
- Open the Result section
- Untick the sections you want to hide
Asking further questions
Lets continue with two more questions.
First:
Which countries are seeing the fastest growth in electric vehicle adoption
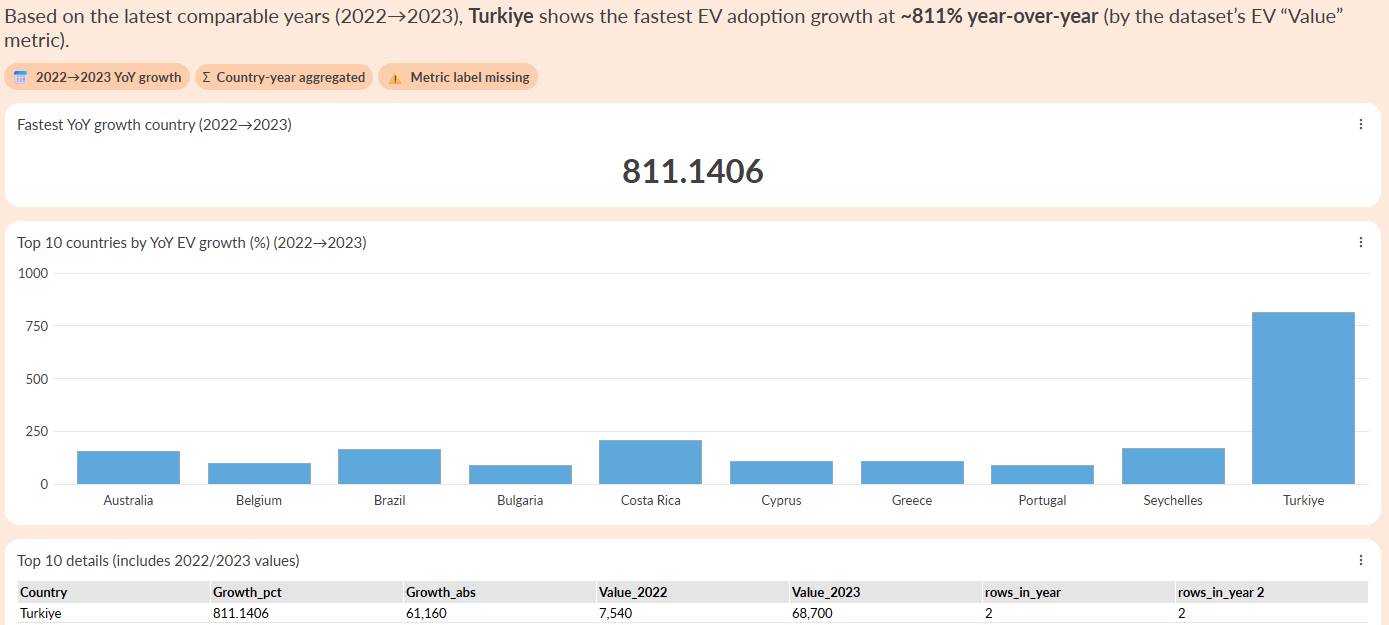
In this answer, we can see that some smaller countries show very rapid growth (for example, Bulgaria and Costa Rica). This kind of insight is difficult to spot in a static dashboard.
Next:
Are the countries adopting electric vehicles faster the ones with lower CO2 emissions per capita?
Here, the AI considers all three datasets together.
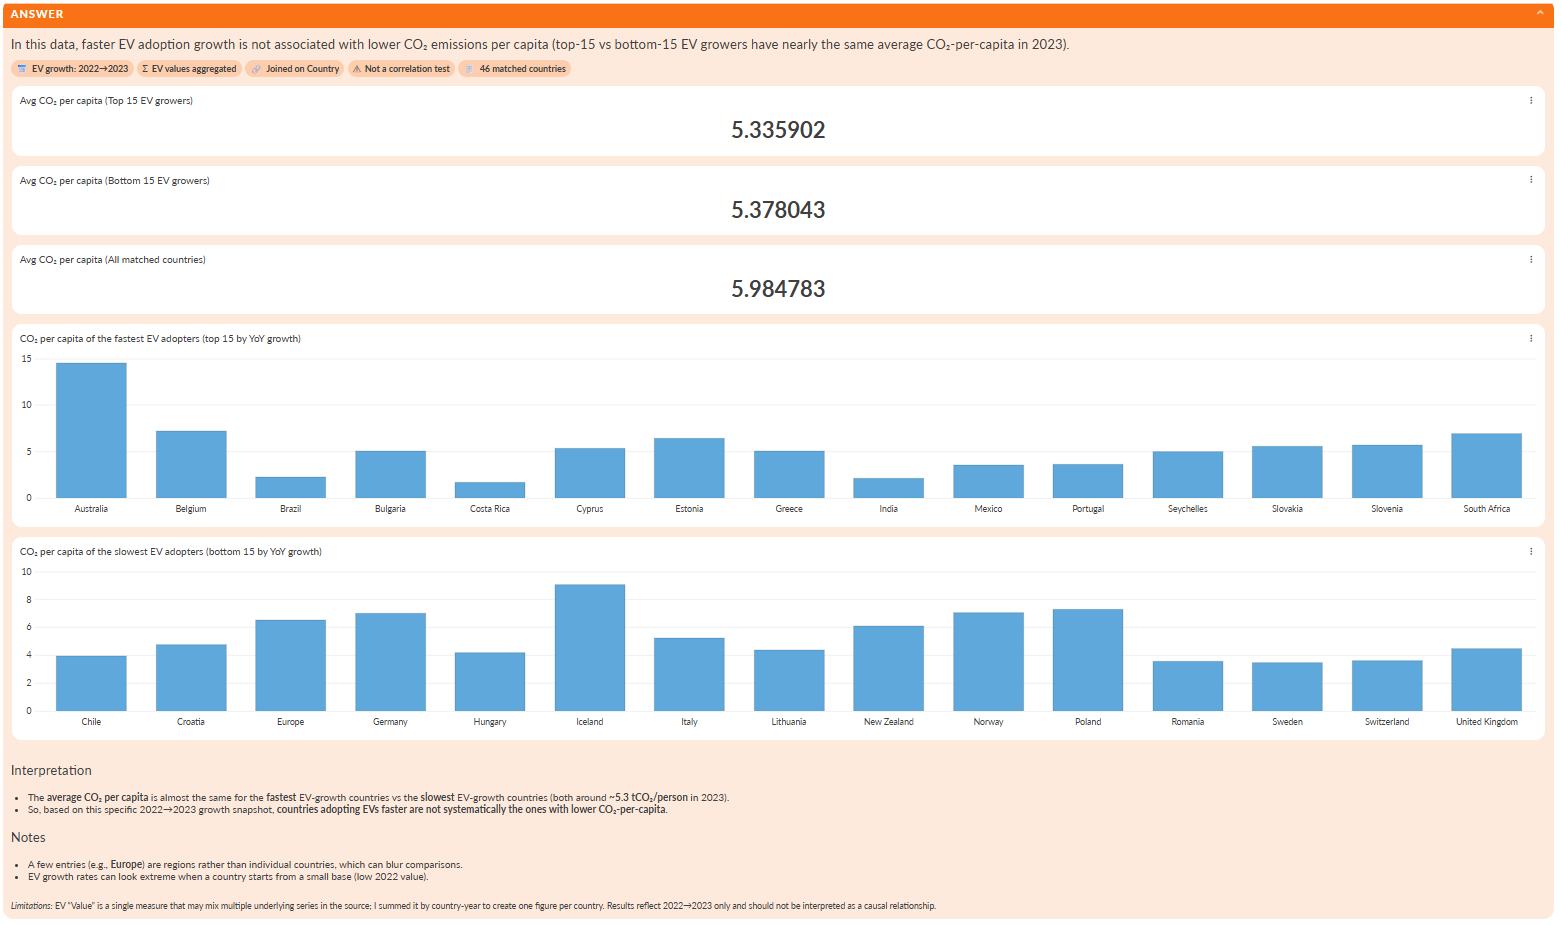
In some cases the AI may explain it cannot reliably provide answer, for example because of differences in data coverage across the datasets. Rather than hiding this, the view makes the limitation explicit, showing where the data is strong and where it is incomplete.
Inspecting the query behind a result
Every chart or Table produced in the Insight view is generated from a series of data transformations. You can inspect these transformations to understand exactly how the AI arrived at the answer.
This makes the view a tool to inspect the reasoning of the model and the generated output. Rather than returning a black-box answer, Omniscope allows you to examine the steps used to generate a result and verify how the data was processed.
To view the query:
- Open the three-dot menu in the top right corner of a chart or table.
- Select Explain query
This opens a dialog showing the query used to produce the result.

At the top of the dialog you will see the query lineage, which shows the sequence of transformations used to generate the result.
Each step in the lineage represents a stage in the data pipeline, starting from the source data and progressing through the transformations that produce the final result.
Each step appears as a selectable node. The step used to generate the current chart or table is selected by default, but you can click other nodes to inspect earlier stages in the transformation process.
Below the lineage, Omniscope shows the query details. This section describes the transformation being performed, and summarises the structure of the resulting dataset.
Depending on the query, this may include details such as:
- The operation performed (for example selecting fields or aggregating data)
- The fields used in the transformation
- Grouping or aggregation logic
- The number of fields and records produced.
These details help explain the reasoning behind the transformation and how it contributes to answering the question.
At the bottom of the dialog is a table showing the query data produced by the selected step.
Inspecting the generated charts behind an answer
When an answer includes charts (Omniscope views), you can inspect the view configuration, the same way you can inspect a data transformation query. You'll be able to see the view settings, for example how a bar chart is splitting data and how the axes are configured, using which field and measure.

Inspecting calculations behind an answer
Insight Explorer can also explain calculations used inside an answer, not just the queries and charts that produced the data.
This is useful when an answer combines values from your data with user-supplied numbers or assumed benchmark values. For example, a user might ask:
At $50 a tonne, what would China’s 2010 CO2 emissions cost?

In this case, Insight Explorer can take China’s 2010 CO2 emissions from the connected dataset, convert the value from million tonnes into tonnes, and multiply it by the user’s supplied price per tonne.
The answer can show the result directly, while still making the calculation inspectable. Clicking the calculation or its explanation badge opens a dialog showing the maths behind the result, including:
- The formula used.
- The final calculated value.
- The input values.
- Where each input came from.
For example, the dialog may show a calculation such as:
china_co2_mtonnes * 1000000 * price_usd_per_tonne
with inputs such as:
china_co2_mtonnes = 8610.048
price_usd_per_tonne = 50

This makes it clear which values came from the data and which values came from the user’s question.
Calculations can also include assumed values. For example, if a user asks:
Roughly how many average cars’ yearly emissions is that?
Insight Explorer may use an assumed benchmark such as 4.6 tonnes CO2 per car per year. The answer labels this as assumption-based, and the assumption can be inspected from the badge or tooltip.

This means users can check not only the answer, but also the arithmetic and assumptions behind it. They can see whether a result used:
- Values queried from the report data.
- Numbers supplied directly by the user.
- Assumed benchmark values.
- Unit conversions or scaling factors.
This is especially important for “what if” questions, cost estimates, equivalence calculations and impact comparisons. Rather than presenting a single number as a black-box result, Insight Explorer shows the calculation so users can verify the maths, challenge the assumptions, and reuse the result with confidence.
From Answers to Reusable Artefacts
The transition from insight to output is at the heart of this view. We enable you to:
- Verify and validate the Logic: Move from a natural language answer to the underlying query lineage, audit the reasoning process step-by-step.
- Download Data: Extract the specific filtered datasets produced by the AI.
- Export Queries and Charts: Save AI-generated transformations and visuals for use in external presentations.
- Save Answers: Preserve explorations for yourself or other team members.
- Reuse Across Analyses: Promote generated queries and views into permanent components of your production reports.
Reusing answers, queries, charts and exporting results
The Insight Explorer is more than just a Q&A session; it is a collaborative component that helps you build your report. Once you have explored, inspected, and verified an answer, you can turn those temporary insights into permanent artefacts:
1. Promote to Report (Reuse across analyses)
As an Editor, you can take any verified query or visualisation and add it to your report layout. This means the AI has helped you do the "heavy lifting" of building the data pipeline and the chart, which you then solidify as a permanent part of your dashboard.
2. Reuse Queries
The data transformations (the logic) generated by the AI can be reused in other parts of your Omniscope workflow. This allows you to leverage AI-discovered patterns to fuel other analyses or data blocks.
3. Save Explorations
Viewers can use this experience to interrogate datasets and save their "Q&A sessions" as Saved Explorations. These can be shared with other users, allowing the organization to maintain a library of verified answers that don't need to be rebuilt from scratch.
4. Export and Download
Use the tools menu on any chart to download the underlying data or export the chart as an image. This ensures that the trust you have built within Omniscope can be exported to your stakeholders with full confidence in the data's integrity.

View configuration (for Editors)
You can configure how the view behaves by opening the chat settings. Here you can choose:
- The model
- The thinking level
- The verbosity of responses
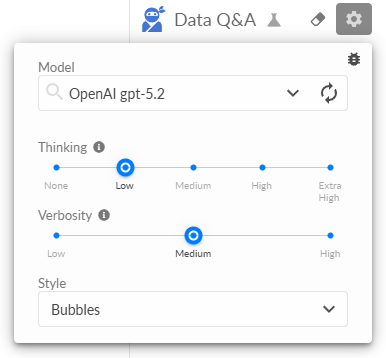
In this example, we use GPT 5.2 with low thinking and medium verbosity. This combination produces answers that are fast and direct, while still being detailed enough to understand without overwhelming the viewer.
By default the view starts by asking:
Tell me about my data
The AI typically responds with a short summary of each dataset connected to the report. This makes it immediately clear what data is available and what the AI can analyse. It can also provide a series of options for analysis, rather than manually typing in a question.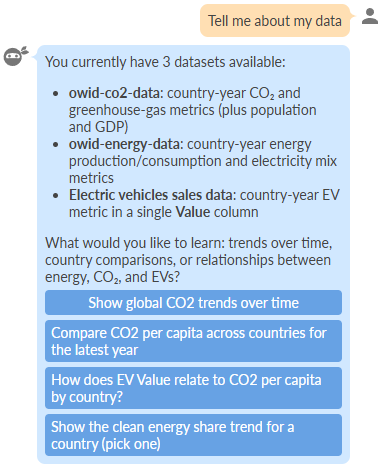
The initial behaviour of the view is fully configurable. An editor can choose how (or if) the AI is invoked when a new session starts.
Open the view settings
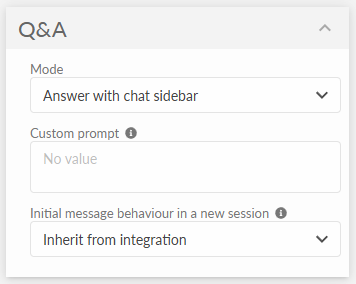
Here we can configure:
- Mode.
Choose between showing the answer with a chat sidebar, or an answer-only view. - Custom prompt
A system prompt that tailors the AIs behaviour - for example, encouraging more visual answers or adding domain specific context. - Initial message behaviour
This determines what happens the view loads:- Inherit from integration - uses the default behaviour, which can also be configured globally by an administrator
- Hidden message - a system message is sent automatically and only the answer is shown
- Assistant message - displays an introductory or suggested message without invoking the AI until the user asks a question
- User message - sends a visible user question immediately and shows both the question and the answer
These options make it easy to adapt the view for different audiences and use cases.
Conclusion
The Insight Explorer view doesn't replace your dashboards - it complements them.
It helps you and your users explore data, understand trade-offs and explain results in a way that's transparent and repeatable. Because it show its workings, its something analysts can trust.
If you're already using Omniscope, the Insight Explorer view offers a new way to interact with your data - one that sits naturally alongside your existing reports.
Was this article helpful?
That’s Great!
Thank you for your feedback
Sorry! We couldn't be helpful
Thank you for your feedback
Feedback sent
We appreciate your effort and will try to fix the article