An Area Range chart visualises continuous data intervals by shading the region between a lower boundary (minimum/floor) and an upper boundary (maximum/ceiling) across an ordered axis - most commonly a time series or continuous sequence.
Unlike a standard Area chart - which fills the space between a single value and a zero baseline - an Area Range chart highlights spread, volatility, uncertainty, or acceptable thresholds without visually anchoring the data to zero.
In Omniscope reports, it is frequently paired with a central trend line (such as a mean) layered on top of the shaded band to show both central tendency and dispersion simultaneously.
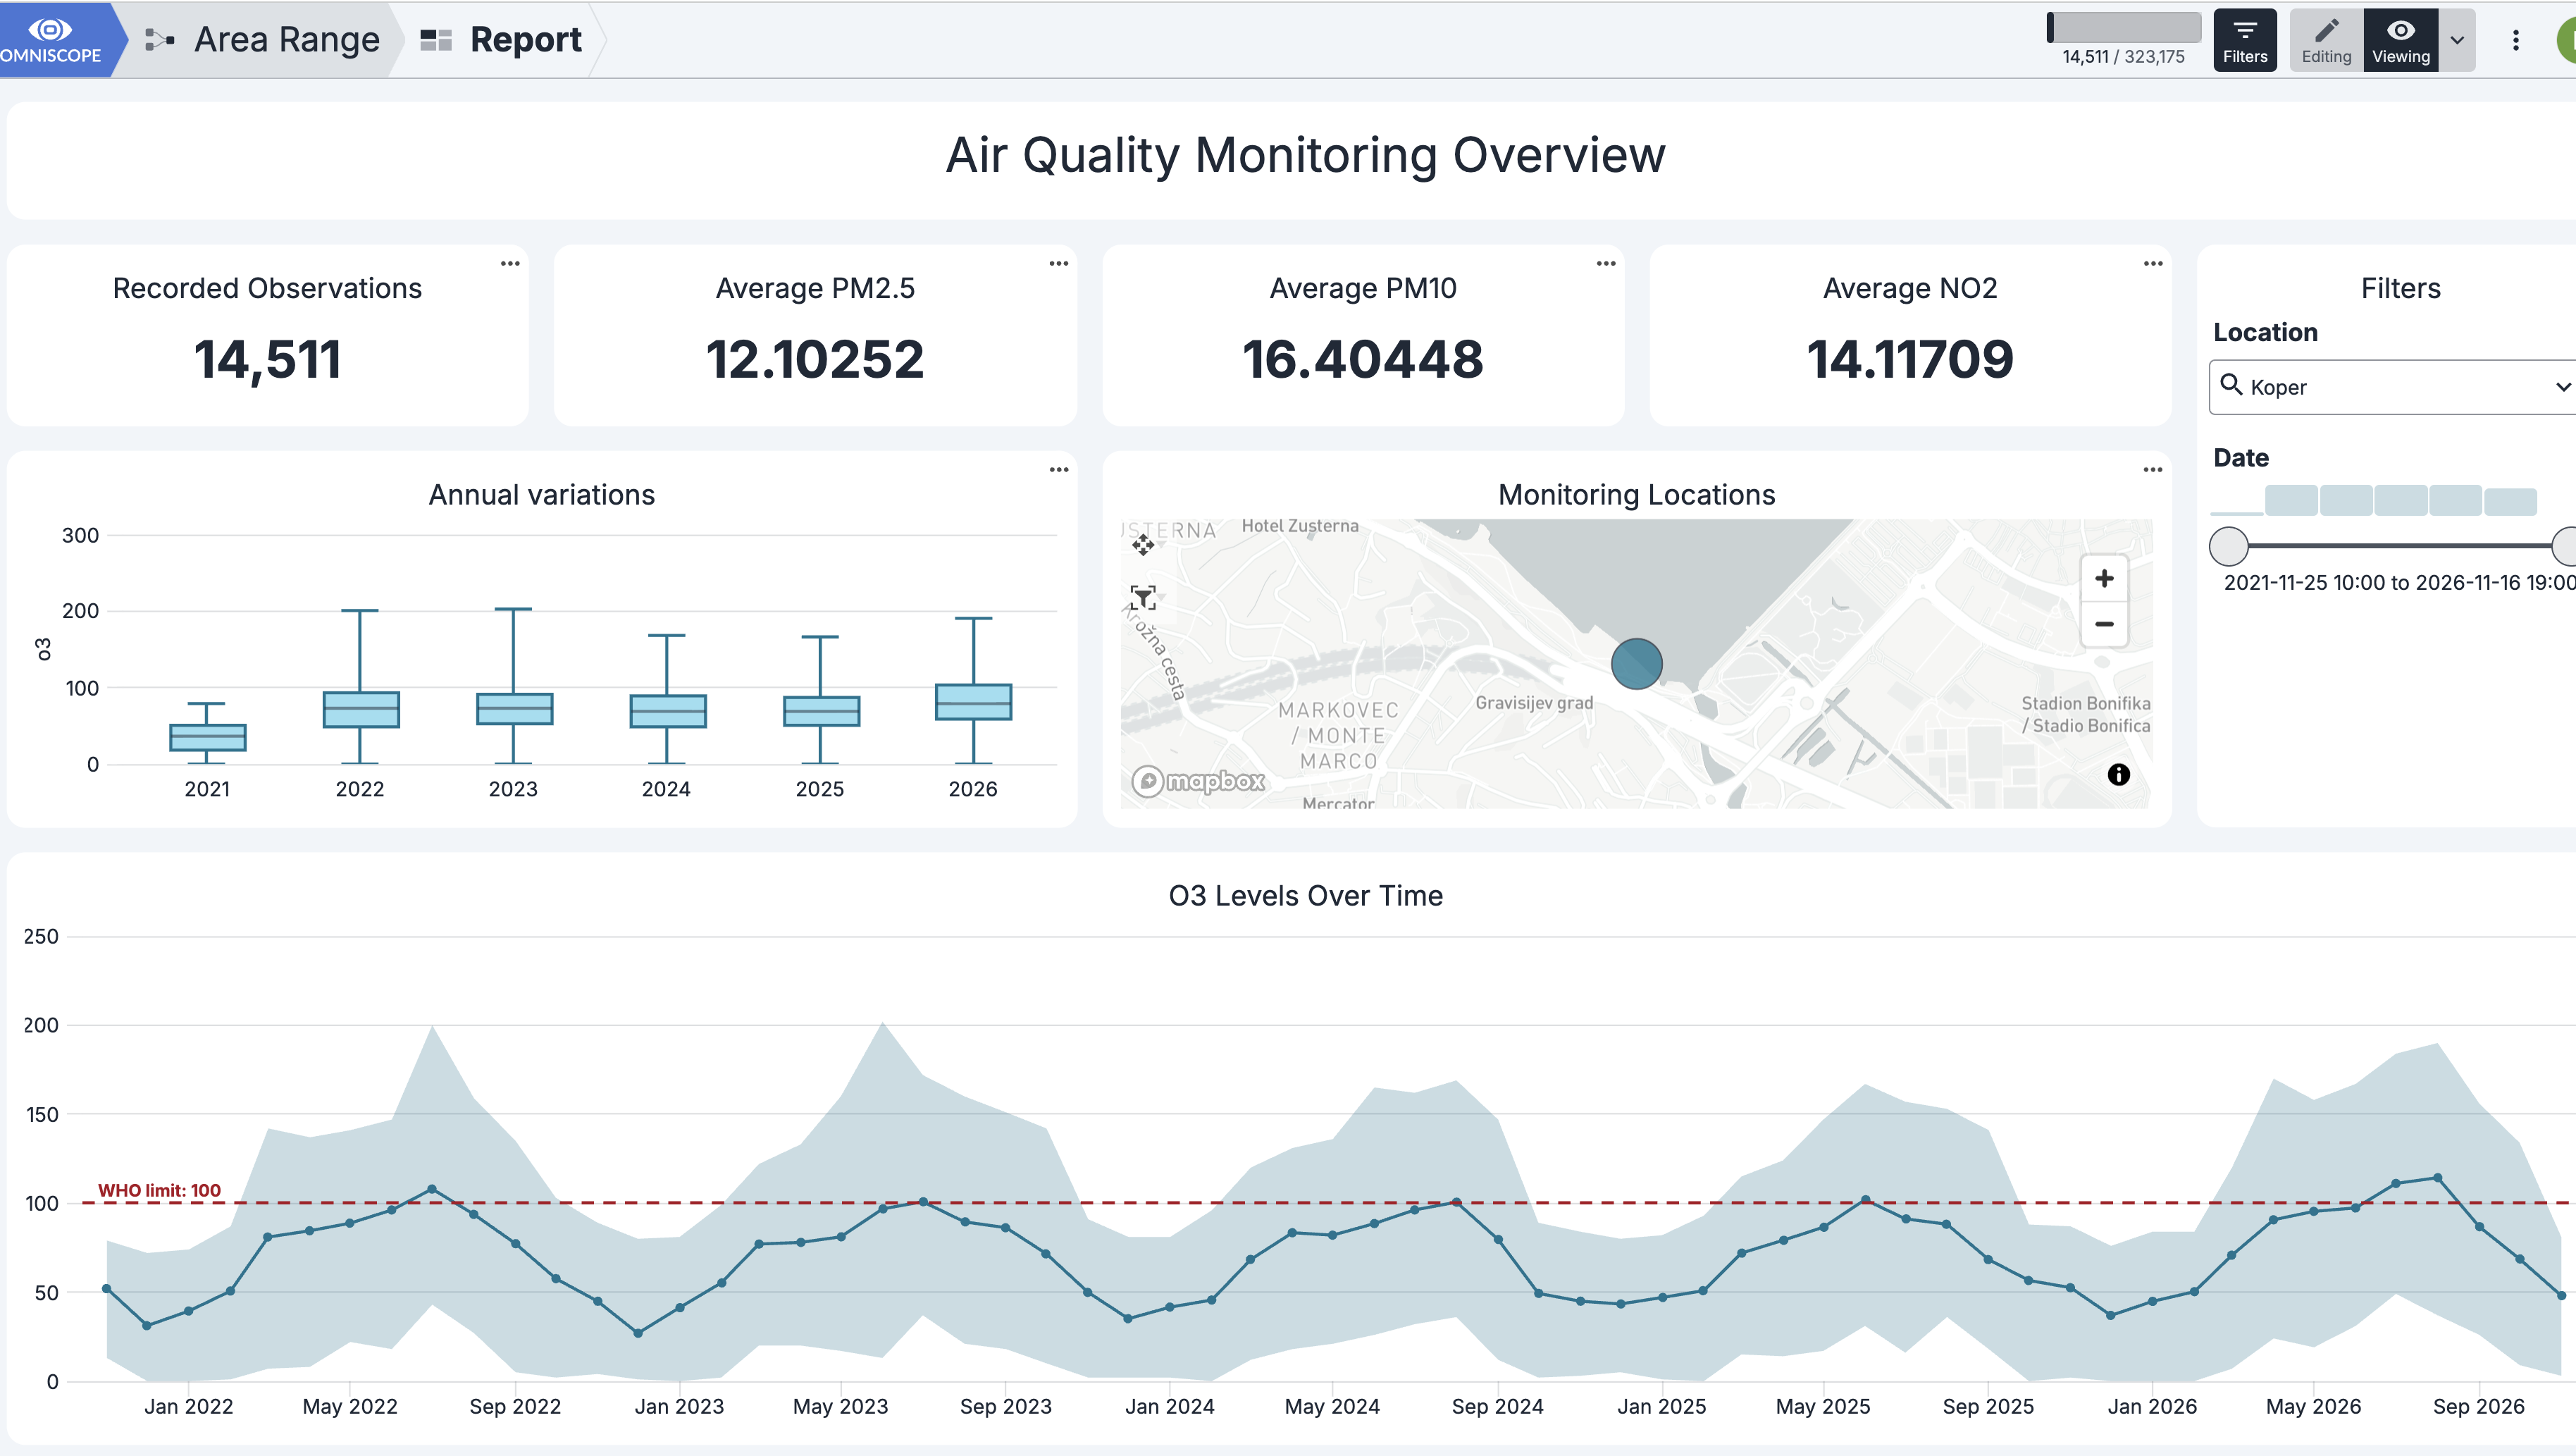
When to Use an Area Range Chart
Use an Area Range chart when your dataset contains paired upper and lower bounds along a continuous dimension and you want to visualise the gap or corridor between them:
Visualizing Variability: Showing how much a metric fluctuates over time (e.g., daily highs and lows).
Highlighting Uncertainty or Forecasts: Displaying confidence intervals, margin of error, or best-case/worst-case projections.
Monitoring Thresholds and Compliance: Defining a "safe zone" or target corridor and spotting where actual values breach the boundaries.
Non-Zero Baselines: Tracking metrics where zero is irrelevant or misleading (such as body temperature, stock prices, or atmospheric pressure).
When to Choose an Alternative
Discrete Categories: If your X-axis consists of unrelated categories (e.g., departments, regions, or product lines) rather than a continuous progression, use a Bar Range view instead.
Cumulative Totals: If you want to show volume building up from zero or parts-to-whole over time, use a standard Area or Stacked Area view.
Survival curve - Kaplan Meier: showing the number of observations (e.g. patients, customers) at the beginning of an observation period, then display change in numbers over time. (see Kaplan Meier Chart - Survival Analysis Visualisation in Omniscope)
Configuring the Chart in Omniscope
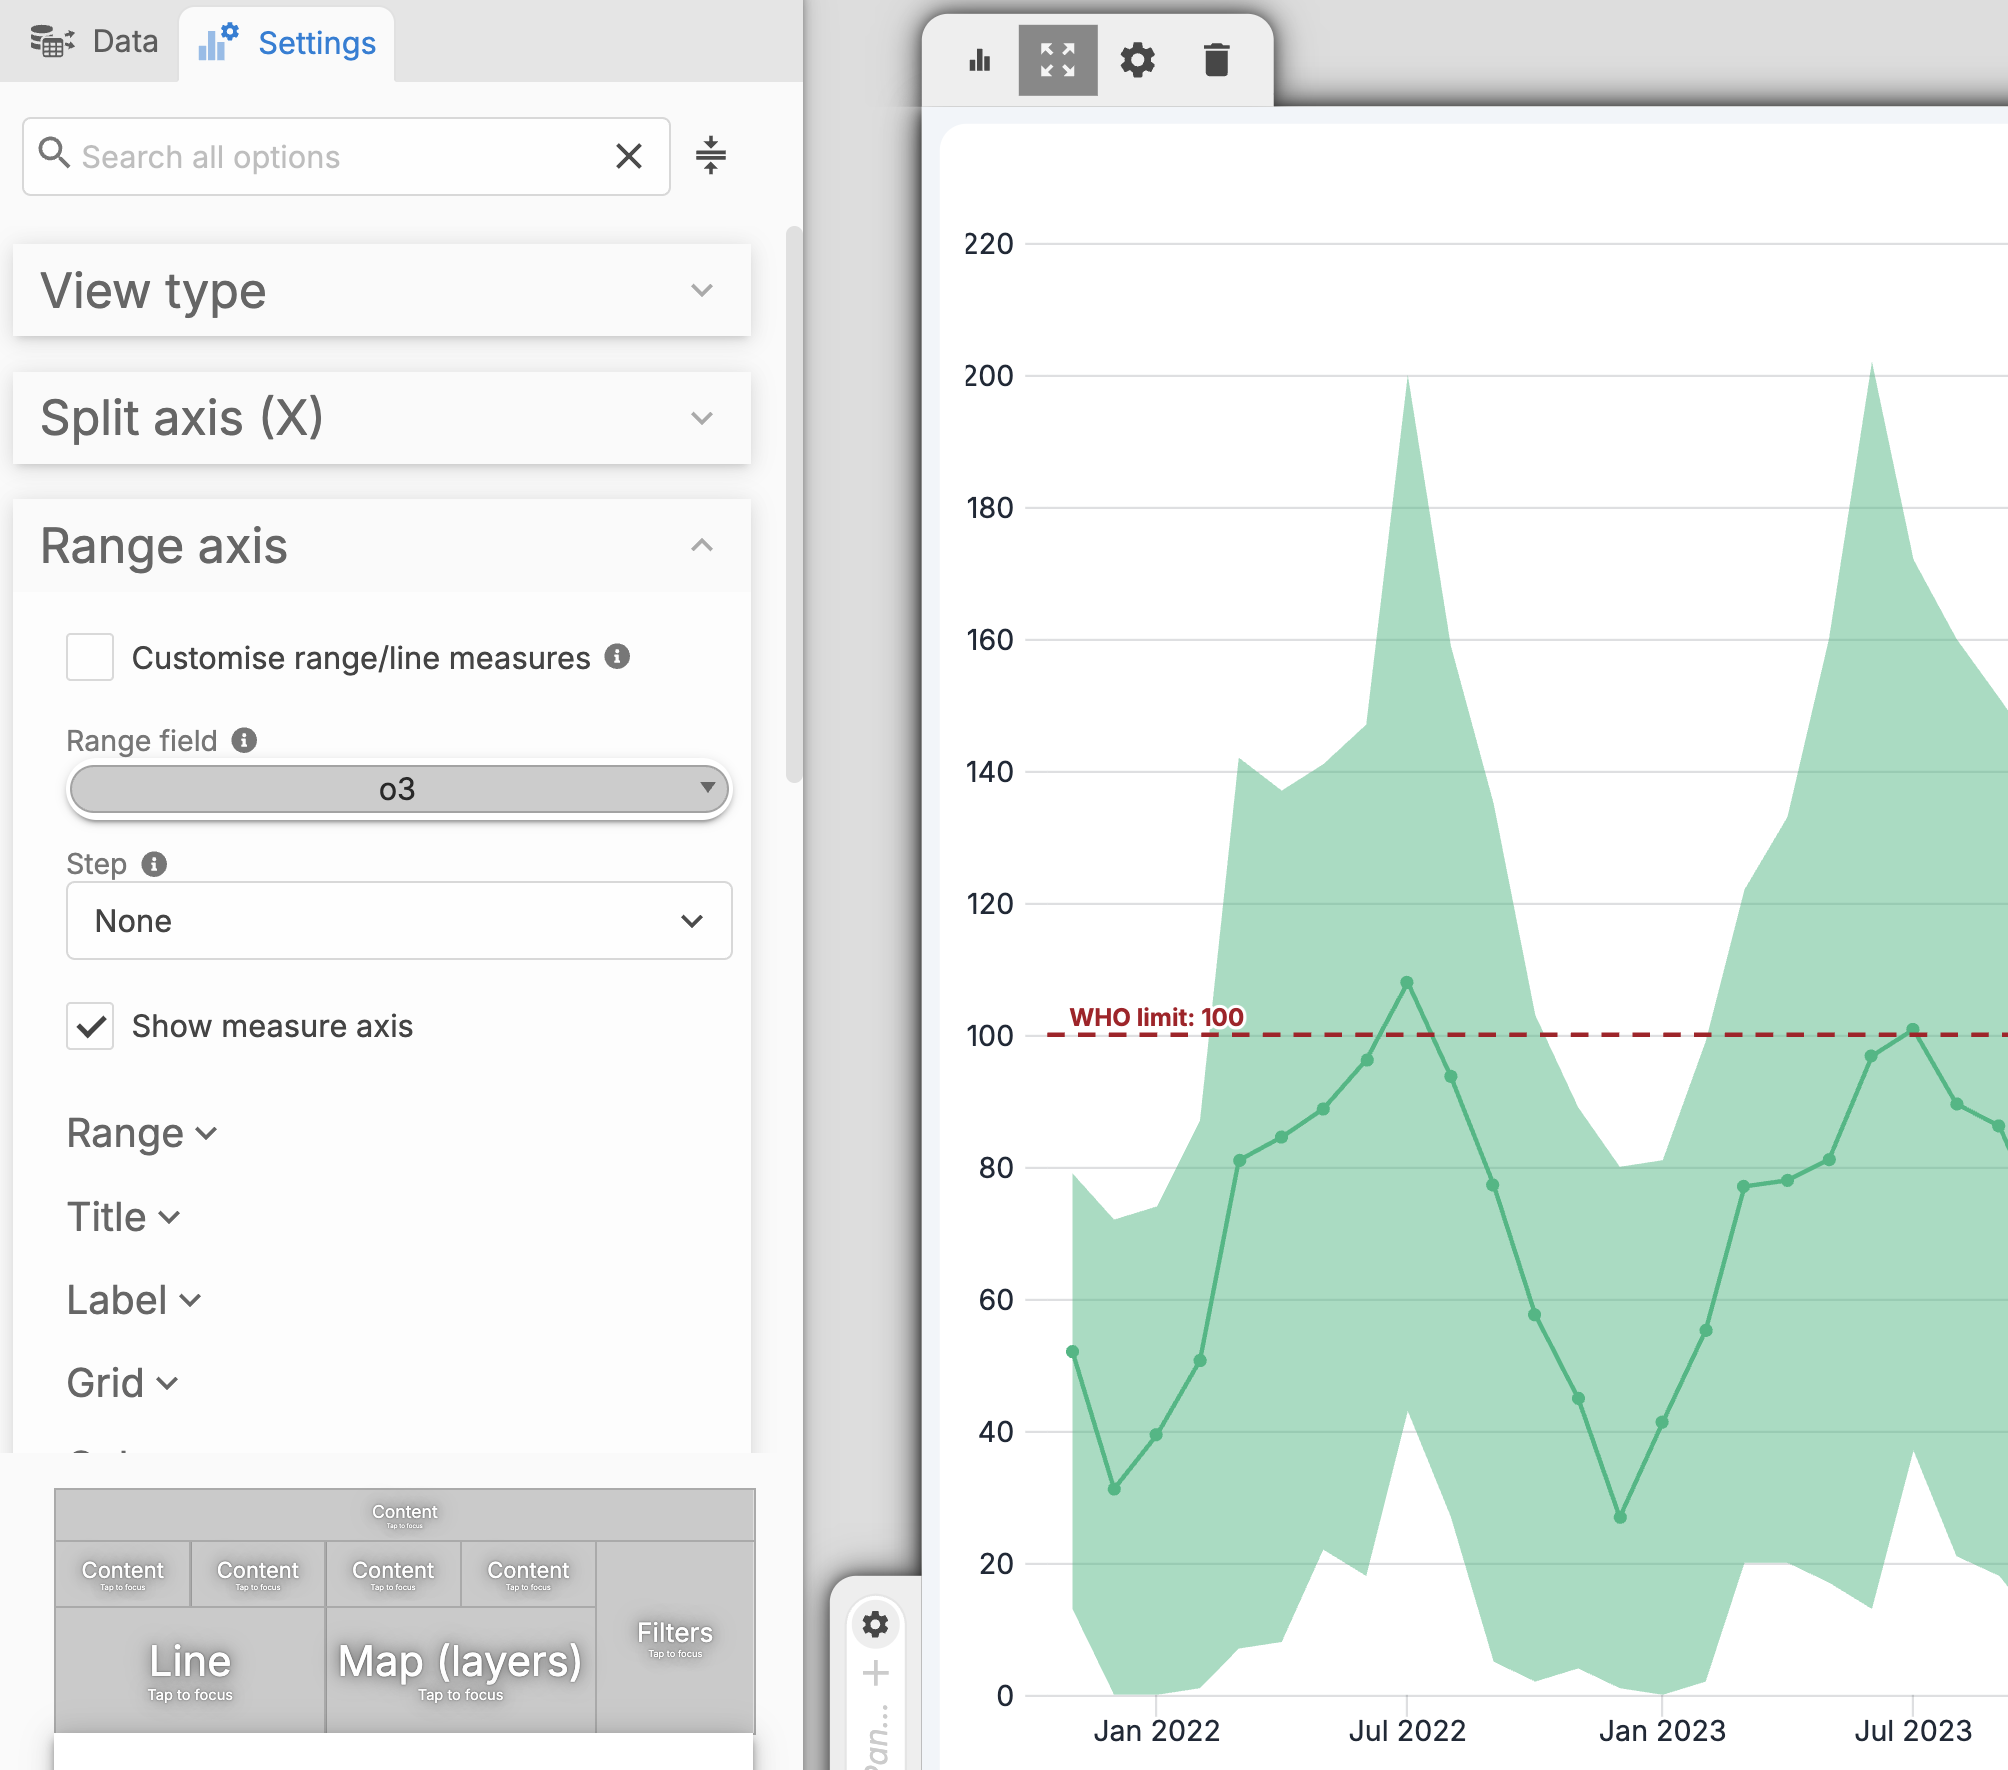
In Split Axis, select a continuous date field.
In Range Axis > Range Field, select the target metric.
By default, the area represents the minimum and maximum values, while the line position represents the mean value.
Additional styling and formatting options are available, including adding a reference line and sizing markers based on a selected field value.
Industry Use Cases
| Industry | Common Applications | What the Range Represents |
| Finance & Economics | Stock price volatility, revenue forecasting, and portfolio risk modelling | Daily High/Low spreads, best-case vs. worst-case projections, or rolling return confidence intervals |
| Engineering & Measurements | Weather telemetry, machine health, and network latency monitoring | Daily min/max temperatures, acceptable operating tolerances (voltage, pressure), or 5th - 95th percentile response times |
| Medical & Healthcare | Patient vital tracking, clinical trial efficacy, and epidemiological modelling | Normal physiological reference corridors, ±1 standard deviation / 95% confidence bands, or projected infection bounds |
| Supply Chain & Operations | Inventory management and supplier delivery tracking | Min reorder points vs. max warehouse capacity, or fastest-to-slowest fulfilment lead times |
Was this article helpful?
That’s Great!
Thank you for your feedback
Sorry! We couldn't be helpful
Thank you for your feedback
Feedback sent
We appreciate your effort and will try to fix the article