The Use Case
When managing multi-source data, unifying regional transactional data into a reliable management view is a constant challenge. Different branches may submit records in local currencies, use different field names and date formats, or structure their files differently, making it difficult to combine the data consistently. Duplicate or incomplete rows, missing values and inconsistent product or customer references can further skew revenue figures and undermine reporting accuracy. Meanwhile, management needs a clear, consolidated view of business performance, with normalised metrics that allow meaningful comparisons across all branches and regions.
To illustrate this, we’ve designed an end-to-end multi-store ingestion workflow in Omniscope capable of dealing with all these challenges:
- automated data quality screening,
- currency-standardisation and KPI calculations
- data anomaly reporting
- AI-classification and summary
This guide explains how the workflow operates and provides a practical implementation guide to help you connect your data sources.
It is important to clarify that this model first inspects datasets one by one: files with structural schema errors are excluded. It then inspects records one by one: individual duplicate, missing, or irregular records are filtered out to ensure that only screened data reaches the final report.
Rejected records are collected and appended with a description of schema issues for each source. This allows the data source vendors (in this case, stores) to check and correct anomalies, establishing a feedback loop as part of a functional data governance process.
Zero-Trust Data Processing - Feed your AI clean data
The model assumes that source systems will inevitably produce bad data - this approach ensures every piece of data is validated and verified before reaching the AI blocks, reducing errors, preventing unreliable outputs and building trust in AI-driven conclusions.
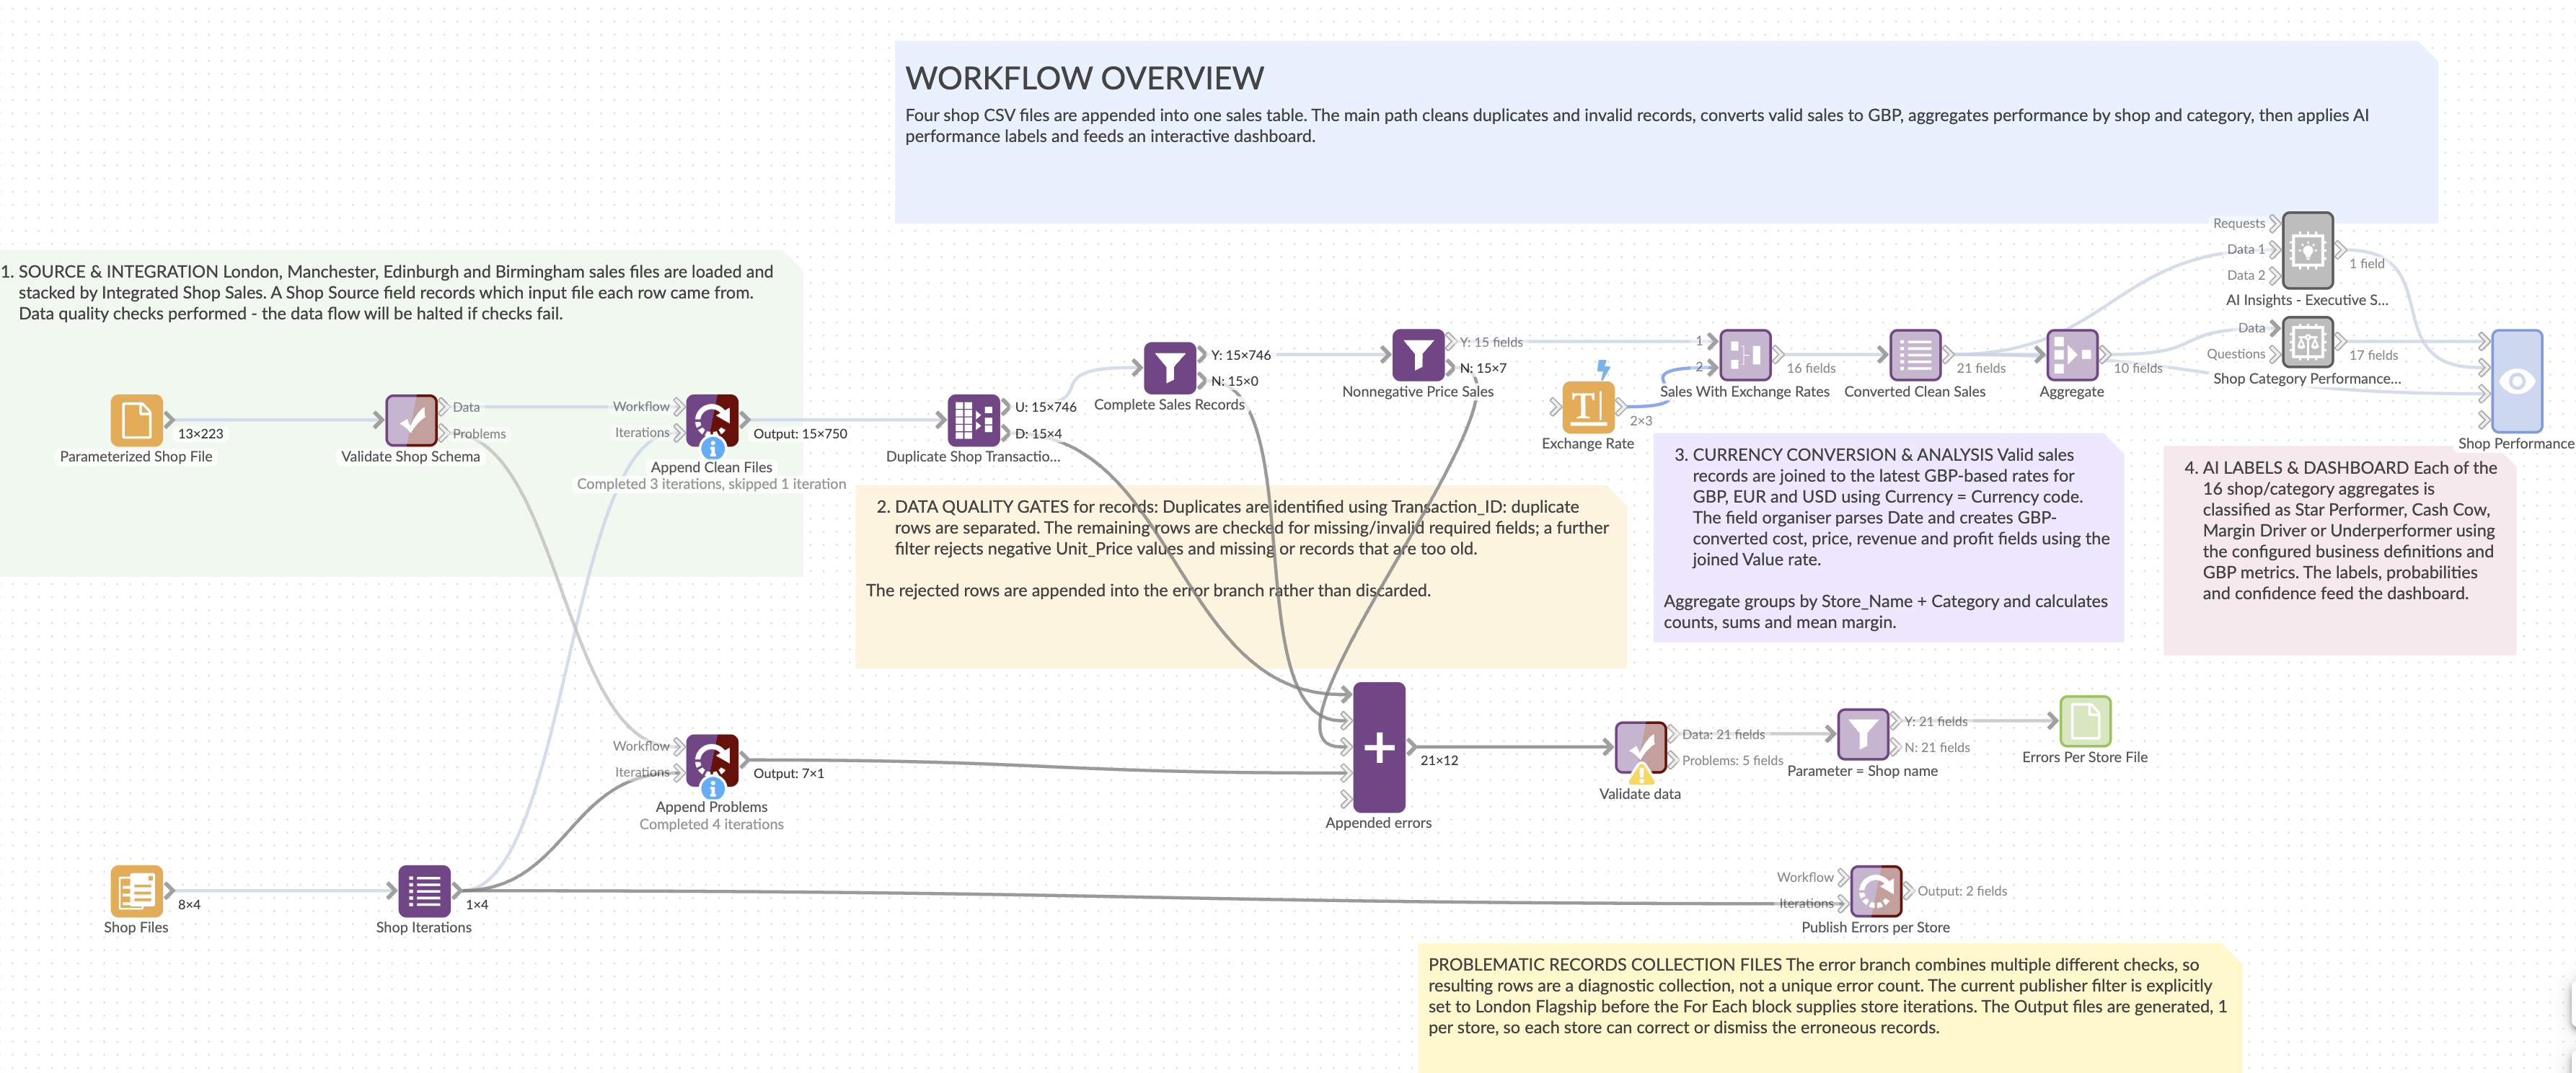
Workflow Overview and Dual-Branch Architecture
The primary goal of this pipeline is to process raw store files containing sales data (in this example - London, Manchester, Edinburgh, and Birmingham), enforce strict quality-screening rules, convert currencies into GBP (for example, online sales may contain values in EUR / USD), summarise metrics by store and category, and surface performance insights via AI labels and dynamic dashboards.
The model relies on a dual-branch design centered around strict data quality screening:
The Main Pipeline (Business Reporting): Processes verified clean records, converts exchange rates, aggregates performance, and populates executive report.
The Diagnostic Branch (Operational Audit): Captures records and datasets rejected during data quality screening, tagging them by source, so regional managers can investigate and fix source data.
Core Functional Stages
A. Ingestion & Structural Schema Checks via Validate Data Block
Directory Scanning: The workflow scans a target server directory for files matching a wildcard pattern (
shop_*_financial.csv). It uses an iteration block to process each store's file separately, allowing some sources to be accepted while others are rejected.Schema Validation: Each file is checked against required field structures and data types. Those with missing, unexpected, or mismatched fields are rerouted to error reporting workflow branch to prevent invalid downstream calculations.
B. Automated Data Value Quality Screening
Clean schema records pass through three strict row-level screening filters before entering the main analytics branch:
Duplicate Detection: Checks transaction IDs case-insensitively. Unique records move forward; duplicate rows route to the error stream.
Completeness & Date Bounds: Rejects rows with missing required fields or dates prior to a particular date.
Price Sanity: Flags rows with negative unit prices.
Rejections are preserved in the diagnostic branch rather than silently deleted, allowing full audit.
C. Currency Standardisation
To compare cross-border store metrics, sales data joins against a central exchange-rate lookup table using currency codes (with GBP as the base multiplier). Using dedicated field organisers, the model calculates converted GBP equivalents for all monetary metrics (cost, selling price, revenue, total cost, and gross profit) while keeping original numbers for auditing.
D. Data Aggregation
The dataset condenses from raw line items down to a single summary row per Store + Category combination. It aggregates total transaction counts, total revenue, total cost, total gross profit, and average profit margins in GBP.
E. AI Performance Labeling and Executive Summary
Each store/category summary row is evaluated by an embedded AI decision block that assigns one of four interpretive performance labels:
Star Performer: High gross profit and strong profit margins.
Cash Cow: High overall revenue volume operating on moderate or thin margins.
Margin Driver: Lower overall revenue, but exceptionally high profit margins.
Underperformer: Low total revenue coupled with weak profit margins.
These labels offer immediate context for management scanning before digging into granular numbers, while AI Insight block generates an executive summary highlighting the main KPIs and trends in this period, ready to use in the report as an addition to the interactive visuals.
Setup Guide: How to Make This Project Work on Your System
Step 1: Set Up Directory & File Discovery, plus Project Parameters
Place your source files in a server folder accessible by Omniscope (e.g., /files/your_company/sales/). Ensure files follow a unified naming structure (e.g., shop_london_financial.csv, shop_birmingham_financial.csv).
Update the Shop Files block with correct folder path and matching pattern.
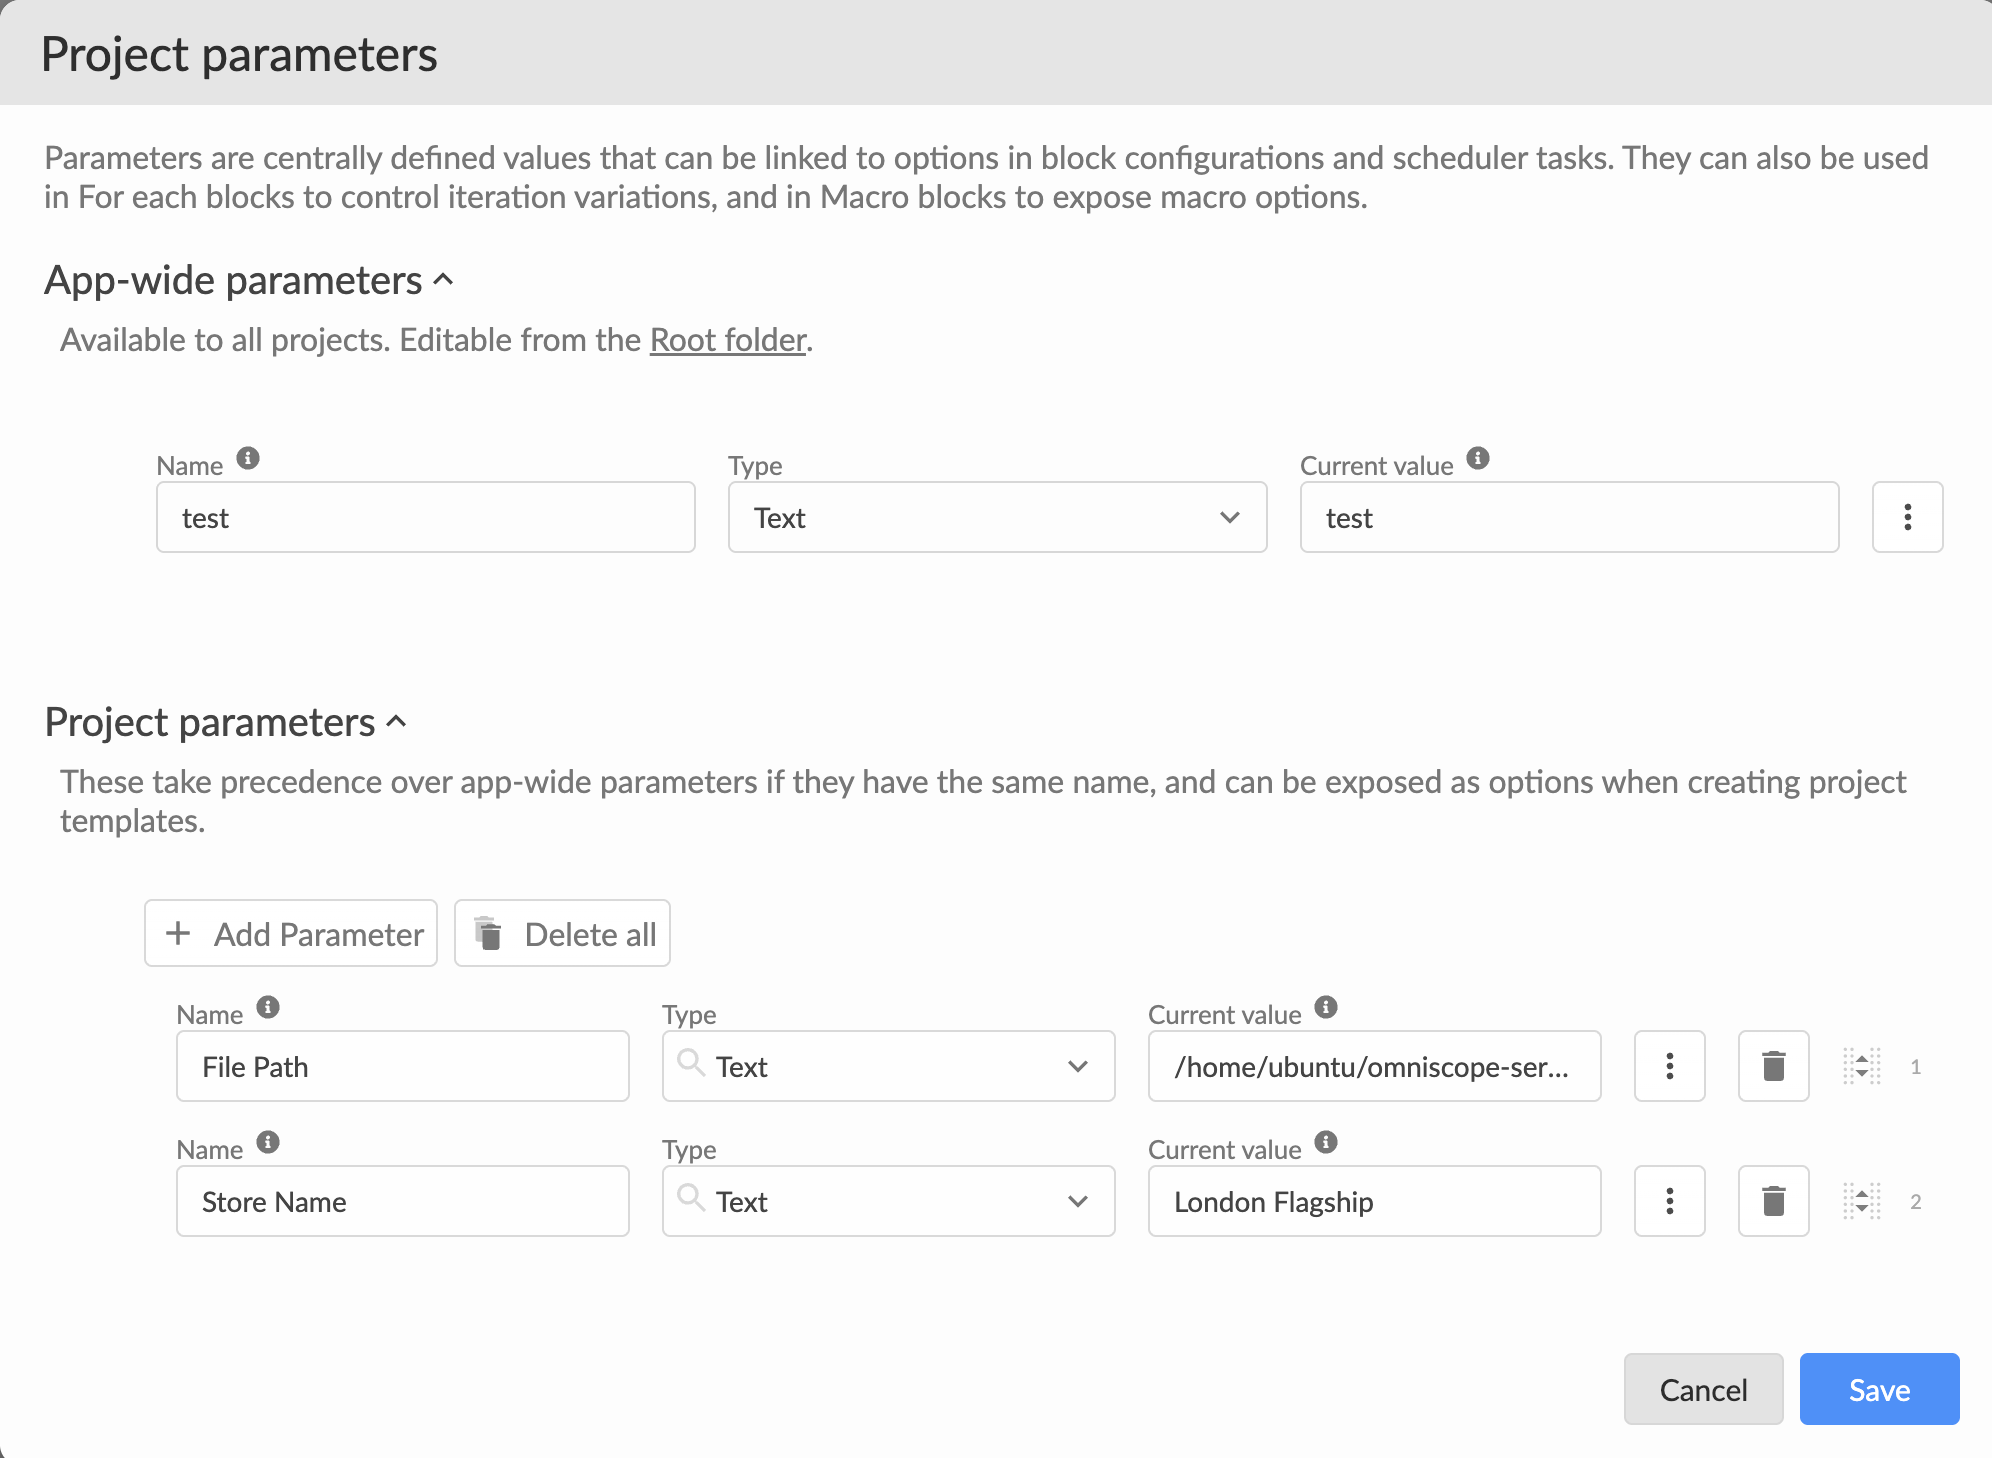
From the 3 dot menu in the project update text parameters "File Path" and "Store Name" (or equivalent) and replace initial values; alternatively create new parameters that match your workflow.
Step 2: Enforce Uniform Columns & Data Types
Connect Validate data block to a file with the desired data schema and click 'reset to match current input' button .
Important: If your systems export varying field names, add a field-renaming block before schema validation (such as Define Schema or Field Organiser).
Step 3: Configure Data Quality Rules & Rates
Review the data quality screening rules to ensure they match your business logic (e.g., confirming whether zero prices or negative prices indicate returns vs. input errors).
Open Exchange Rate text block and enter current conversion rates relative to your base reporting currency.
Step 4: Correct Error-Branch Parameter Loop
To ensure store error CSVs generate correctly for each region:
Open the per-store error publishing branch.
Link the iteration configuration to loop on actual
Store_Namevalues rather than input file paths.Configure the output block to save to a designated log directory (e.g.,
/home/ubuntu/omniscope-server/files/your_company/Sales/Errors_{{Store Name}}.csv
Note: The value between double curly brackets is a parameter, while the whole combination of fixed text and dynamic parameter represents a 'templated' parameter type (available from a drop-down menu in parameterised block options).
For Each block is used to extract source data from a folder, one file at a time, and then output faulty data reports, again, one by one, for each store (parameter value).
The way the For Each block is set up is slightly different in those scenarios, so it's worth checking the block options.
The block generating the output files doesn't have a workflow input, but does have a target block selected in the 'Additional blocks' section. Because the output file block is linked to the parameter in the file path, this looping will initiate the publishing of multiple individual data anomaly reports.
Step 5: Execute & Validate Results
Run a full execution of the workflow (avoid relying only on preview mode). Review your error CSVs to verify rejected records and schema errors, and launch Shop Performance Dashboard to view the final result.
Report Tip: To use insights generated by AI Insights as an executive summary or narrative in your report, use Details view. Make sure to untick all fields in the Fields section, select the [AI Response] field in the Description option, and tick 'Description contains markup' underneath.
Conclusion
This approach allows us to evaluate records and whole datasets one by one - our automated workflow has a built-in ability to accept, reject, and reroute individual records or entire datasets. This method allows management to view the latest validated data while also speeding up anomaly corrections by providing data vendors with detailed fault reports.
Sample files attached.
Further reading:
Was this article helpful?
That’s Great!
Thank you for your feedback
Sorry! We couldn't be helpful
Thank you for your feedback
Feedback sent
We appreciate your effort and will try to fix the article